Contents
Nathan Bear LottoX Indicator Revealed
When Nathan Bear revealed his LottoX strategy few months ago, one thing came across loud and clear – he loves what he’s doing. More importantly, he has an undeniable passion to pass along his knowledge to others.
During Nathan’s live trading presentation, he pulled out two picks to introduce the service – SDC and YETI calls.
— RECOMMENDED —
Log Into Marc Chaikin’s $5,000 System Today
Recently, I met with a Wall Street living legend.
He told me about a system he’s created over the past 50 years…
At first it sounded like B.S. – until I tried it myself.
Last year alone, it pointed to Riot Blockchain before it shot up 10,090% in 11 months…
Digital Turbine, before it shot up 789% in 8 months…
Overstock, before it shot up 1,050% in 4 months…
and more.
His former clients paid $5,000 a month to access its findings.
Today, he’s allowing me to offer you free access to the system here, as part of a major new prediction he’s making.
These were Nathan Bear’s highest conviction trades based on his LottoX indicator.
How did those two trades perform?
First thing the next morning…
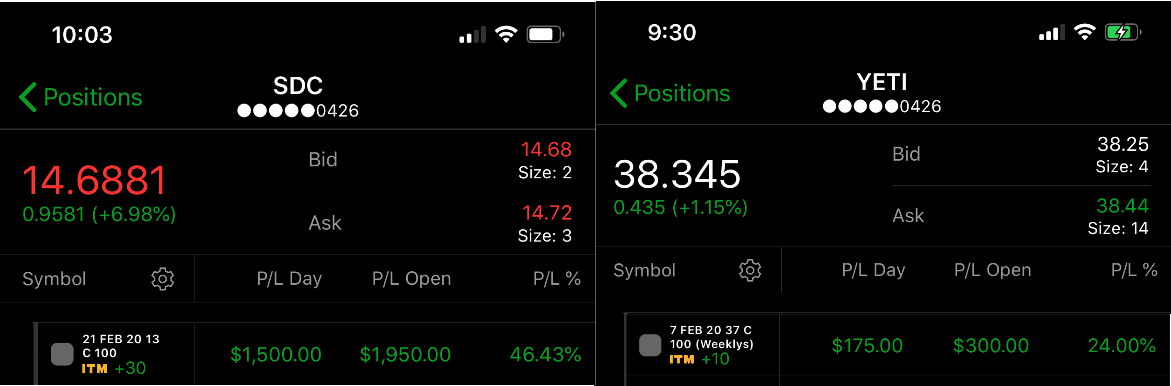
Not too bad for Nathan’s first set of alerts in LottoX!
You’re probably wondering what made these stocks special? And what compelled him to pull the trigger?
Believe it or not, Nathan used techniques you’re probably familiar with. However, he might not use them in ways you’re accustomed to.
Let me explain…
— RECOMMENDED —
 How to Boost Your Income by AT LEAST $36,000 Over the Next 12 Months
You don’t need to find a second job, discover a once-in-a-lifetime value stock, or speculate with cryptocurrencies. Last year, this 94% accurate, crisis-proof strategy handed some Americans the opportunity to make an extra $27,411. And early returns show 2022 could be even better.
Complete details are right here.
Trade With Strong Trends
You probably heard the saying ‘the trend is your friend.’ It’s actually true.
Trading against the trend is like salmon swimming upstream. I found out long ago that it’s much easier to trade in the direction the stock wants to move then pick off tops or bottoms.
One question I often get is how I identify trends. I wrote about this a while back in my newsletter Spotting Trends the Right Way. To boil it down, you want to look for stocks where the direction is obvious.
This is a classic uptrend.
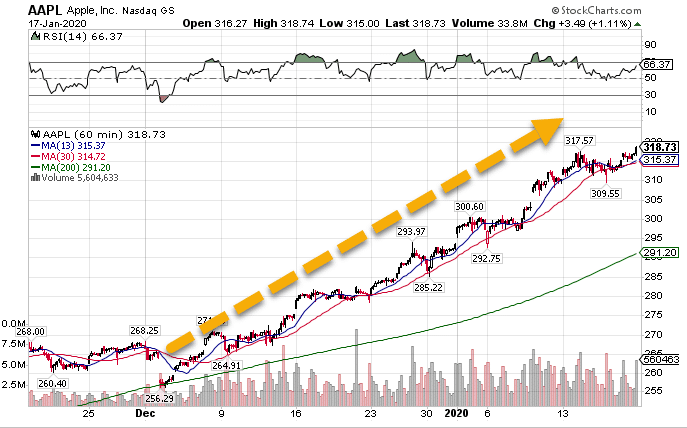
AAPL Hourly Chart
If you saw a stock trading this way, it wouldn’t make much sense to try to short it. That would make your life very difficult.
Similarly, you wouldn’t want to bet on a turnaround in this stock.
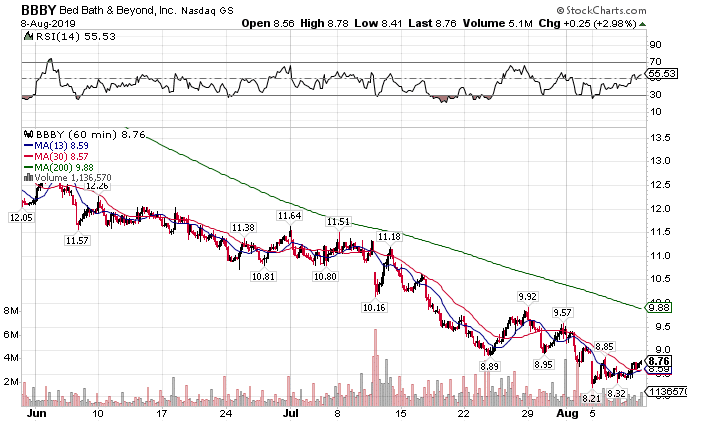
BBBY Hourly Chart
You might get lucky and pick the turning point. But chances are you lose money instead.
When you look at a chart of SDC, you can see how it has a nice uptrend off the bottom.
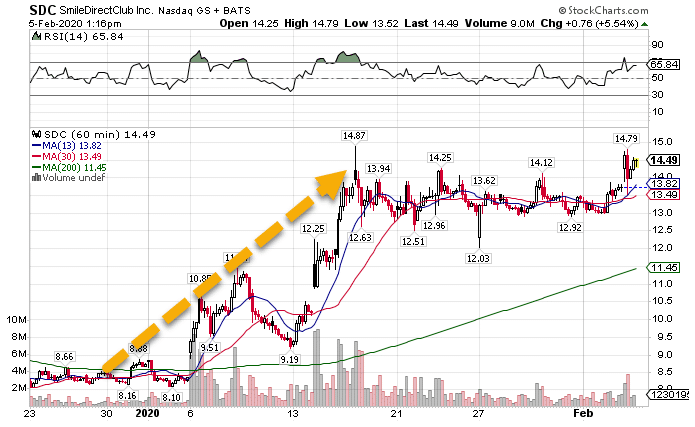
SDC Hourly Chart
YETI had a similar look with a push higher recently.
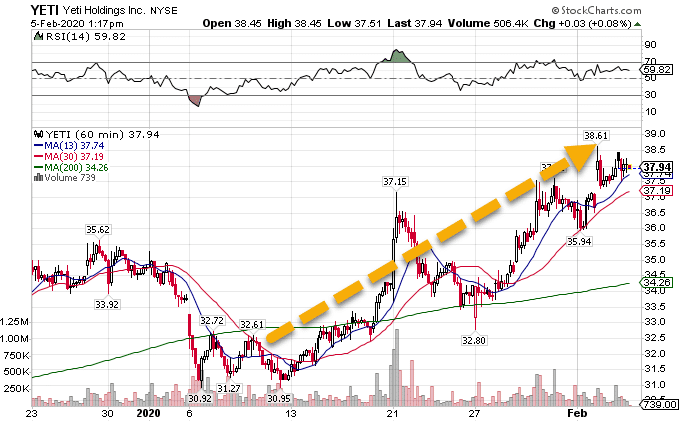
YETI Hourly Chart
Create a List of Stocks
I like to trade stocks that move around a lot. These wide ranges give me an opportunity to pick up explosive moves in the options.
What I consider a ‘wide range’ is relative to the stock’s price. A $15 stock that swings around $1 daily is more interesting than a $150 stock that swings around $1.
I tend to keep a list of stocks that I like as my ‘go-to’ for picking out trades. This list includes charts that I like, ones with nice volume on the options, and easily identifiable trends to work with.
— RECOMMENDED —
 The Biggest Commodity Bull Market in History?
“Commodities will be THE trade of the coming decade,” says the senior analyst behind 24 triple-digit winning recommendations. And it’s not just because they’re among the best ways to BEAT out-of-control inflation… but because they’re at the beginning stages of a massive cycle – one that could hand you quadruple-digit gains if you get in now.
He details his No. 1 favorite commodity play, right here.
Look For Price Consolidation
Explosive moves out of stocks start with areas of consolidation (otherwise you’re trying to play reversals which I don’t do). I look for charts where the trading range for a price compresses as it goes on.
When price starts to compress, it means that energy is building to break out of the consolidation range. The longer and narrower the price channel, the more explosive the move.
That’s how I played SDC and YETI. Check out how the SDC hourly chart shows price consolidating in a range after a large up-move.
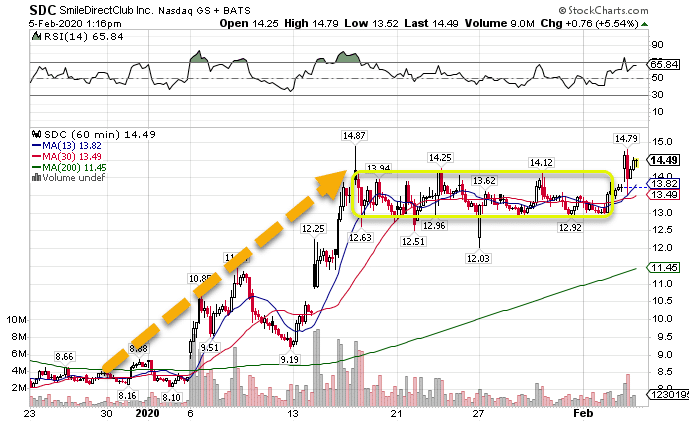
SDC Hourly Chart
Notice how price started trading in a narrower range after the big push higher. That normally leads to another leg moving off in the same direction.
Use Options to Your Advantage
Most traders start and stop with buying and selling stocks. They rarely dabble in the world of options. Half the time it stems from misconceptions around the products.
Here’s the thing. Options offer leverage for trading stocks. When used responsibly, they make your capital usage more efficient, not less.
Consider the following – you want to trade 100 shares of YETI. If you bought 100 shares it would cost you $3,800. A call option that controls 100 shares of stock cost me $120.
Don’t get me wrong, I pay a premium for the right to use that leverage. But I’d rather risk $120 on a stock then $3,800. Look no further then Tesla as to why. The last thing I want is to wake up one morning and find a stock I hold cut in half or worse.
Use Nathan Bear LottoX Indicator For Your Trading
One of the easiest ways to grow your account is to trade with the LottoX indicator. It’s timed my trades over and over – already proving itself right out of the gate.
— RECOMMENDED —
 Most Important Stock Warning ALL YEAR
2022 has been a tough year for investors, but that stops today. Especially for you. Tune in now to hear from a chief analyst on how to survive and even thrive in today’s turbulent market… including a bold new prediction you won’t hear anywhere else.