As an active trader, I primarily focus on the technical aspects of the market. It helps me get a read on the market action, and prepares me for my SPY trade of the day. I use these tools to find my entry points, calculate stop losses, and monitor price action in the global markets.
But it wasn’t until I discovered a market sentiment tool called the TICK INDEX…
…when my trading started to improve and become more consistent.
The TICK Index is an indicator that analyzes the entire INDEX for potential weakness, money flows, and other important signals of strength that a trader can take advantage of.
This index is understood to be one of the most well known market sentiment indicators used by a majority of the industry professionals.
It’s time you put the TICK Index to work for you and start getting on the right side of the markets!
Contents
The TICK Index – Daily Deposits Review
The TICK Index is defined as the calculation to allow you to compare the number of stocks that are rising to the number of stocks that are falling on the New York Stock Exchange (NYSE).
What does this do?
In short… The TICK Index is just the summation of all stocks that are making an up-tick subtracted from the stocks making a down-tick.
The Formula:
TICK Index = Sum of up-tick stocks – Sum of down-tick stocks
For example:
There are roughly 3,000 stocks listed on the NYSE. What would the $TICK be if 2,000 socks have made an uptick and 1,000 stocks have made a down-tick?
Answer: TICK Index = 2000 – 1000 = +1000 $TICK
In the US, the stock market comprises 5 major market indexes; the NYSE, Russel, S&P,Dow Jones, NASDAQ. Each of these 5 major markets all have a TICK Index that is associated with them.
Note: It’s important to remember that each market has their own TICK associated with it. For example, the $TICK is the index for the NYSE stocks, not the NASDAQ. This means if you see an overreading of the $TICK (NYSE), I wouldn’t recommend trading the NASDAQ against this signal.
For your reference, here is a table of all of the TICK symbols and the exchange they are associated with.
| New York Stock Exchange | $TICK |
| Russel 2000 | $TIKRL |
| S&P 500 | $TIKSP |
| Dow Jones | $TIKI |
| NASDAQ | $TICK/Q |
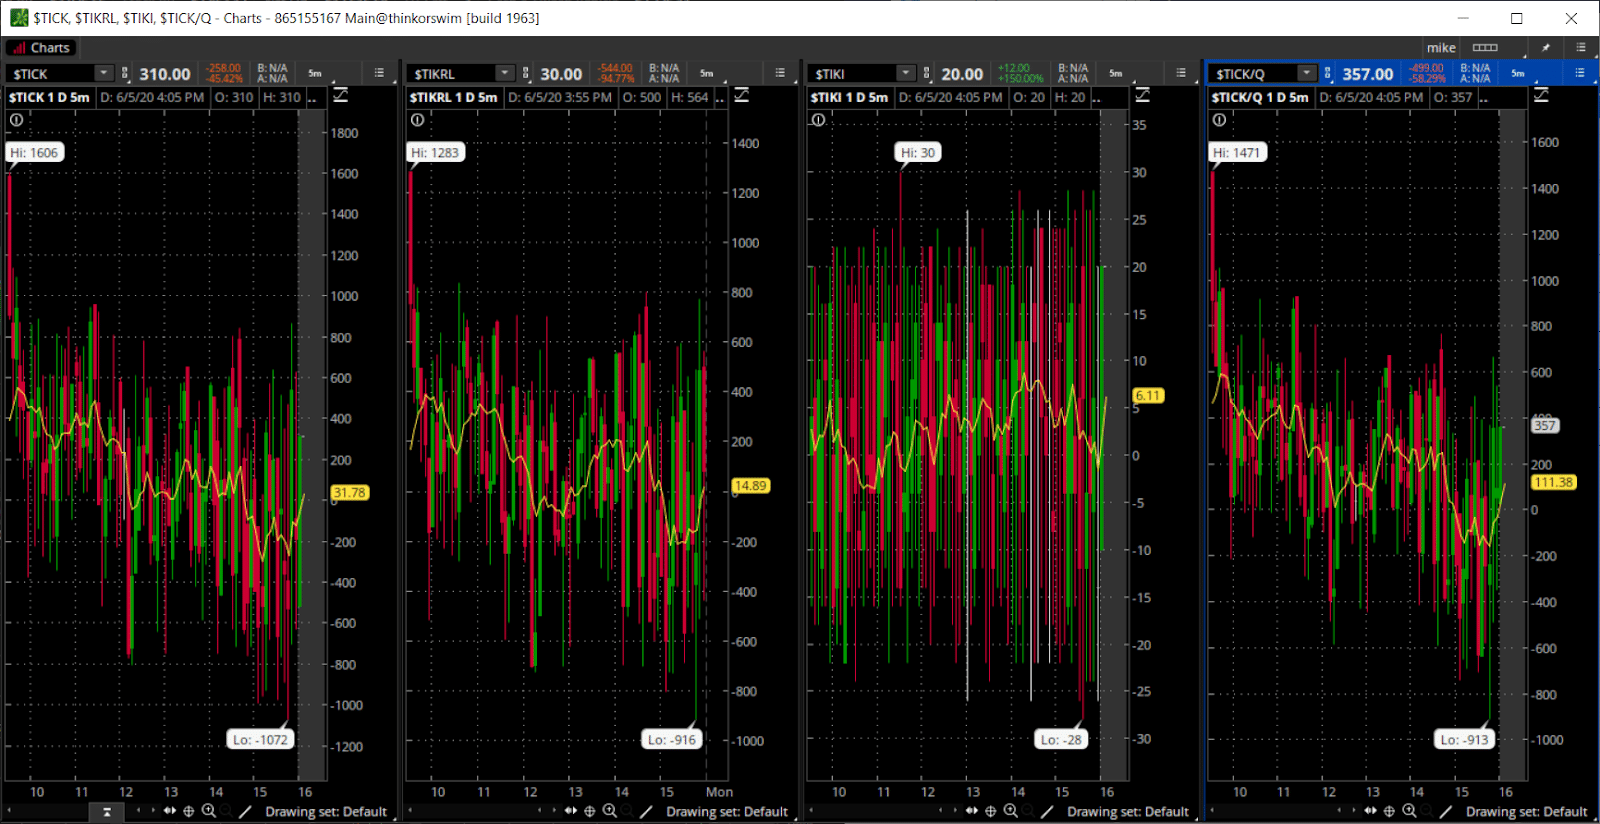
Source: Thinkorswim
The above image is a view into the 5 major TICK Indexes, with their values plotted as bar charts.
Since Daily Deposits focuses on the SP 500 ETF, the SPY, and many (if not all) of the stock trade on the NYSE… I am therefore going to use the $TICK instead of the $TIKSP reading.
How To Read The $TICK – Daily Deposits Review
Let’s take a look at a chart that overlaps and compares the TICK to the SPY.
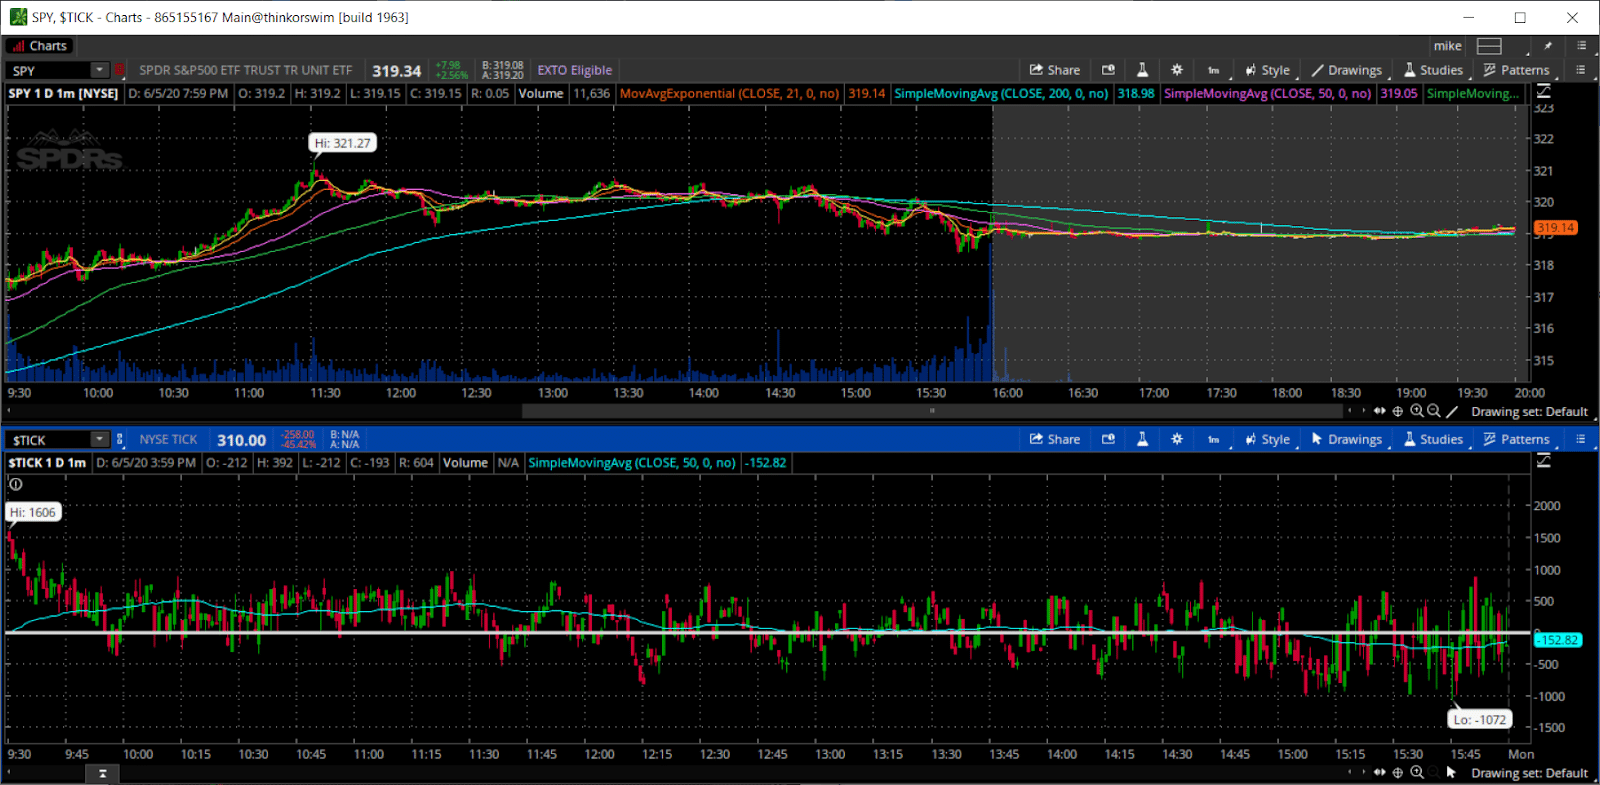
Source: Thinkorswim
So what do we see from this image?
Overall it appears that the markets were strong and continuing their upward momentum from the pre market session.
But as a professional I take it one step further.
In this image, I see a strong SPY being driven by a strong $TICK index that allows the markets to continue the momentum throughout the morning prior to tapering off in the afternoon.
What does the SPY/$TICK chart tell us?
- The strong momentum is supported by the $TICK’s above 0
- The Moving average of the $TICK is above 0
- The moving average of the $TICK is increasing to flat all morning
- Once the TICK and the moving average drops below 0, the SPY begins to slow down and fade
Pro Tip: Make sure not to be fooled by the red candlestick at the open on the TICK and think the market is going to collapse. In fact, many times the TICK will be inflated due to Market On Open orders being filled and can be false signals. Instead be sure to reference a longer period moving average to get the true picture on the direction of the TICK.
What do you do?
There are a few things to do here so let’s take a look at what to do when you are faced with a setup like this.
Now…if you are looking to trade the momentum on the SPY, it’s important to always monitor the market internals before placing your trade. This will confirm the direction of your trade and give you a higher probability of success than blindly trading the SPY itself.
The trade
Since the markets are this strong, it’s safe to say that your best price will most likely be the open.
In order to capture this trade, make sure that you’re able to monitor the SPY and the options markets for narrow bid-ask spreads and wait for price to “settle in” prior to execution. This will ensure that you are given a fair price for your options by the market makers and don’t get caught up in the 9:30 bell excitement.
The outcome
The SPY’s were an absolute screamer today, and in fact, the open was the best place to execute your trade at.
Even though there was a slight pull back towards the end of the day, there was not much to be worried about. The SPYs showed that buyers were in control and they were looking to push the markets higher.
And in this case, there were no divergences between the SPY and the TICK to cause any confusion or hesitation in the trade. From the beginning of the day, the TICK and the SPY were trading together.
TICK Index – Why Does It Matter
Let’s step back now and take a look at the bigger picture for a minute and ask ourselves a few questions.
Why does this matter?
How is this relevant to a day trader?
Why do I need to pay attention to something that I do not trade?
To answer those questions quickly – it’s because there is never too much information to have as a trader! The more information you have available, the better and faster your decision making is.
Remember – the TICK Index is recording the buying and selling action of an entire index!
The TICK tells us how many stocks are selling “at or below” the asking price and how many stocks are being bought “at or above asking price.”
Basically, it is a measure of buyers vs sellers to determine how aggressive one side is compared to the other (at this point in time.)
The next question you would want to ask is, is this extreme price action occuring on all markets or just on a single market index.
If all major markets suddenly have aggressive selling pressure, then I would want to know why this is happening.
Perhaps, at that point, you would also not want to take a position until you found out exactly why.
How To Use The TICK Index – Daily Deposits Review
Now that we know why this is important, let’s see how we can use this information to make informed trading decisions.
Understanding the TICK index offers traders a great short-term perspective of overall market sentiment and how the rest of the traders feel about the market prices.
The ratio of stocks on an up-tick versus the number of stocks on a down-tick allows a short-term actionable data point for traders to take advantage of.
How to read the TICK Index “zones”:
- Value between -300 and +200 indicates a neutral market sentiment and gives traders a “wait and see” signal.
- Values greater than +200 indicate a bullish market sentiment and signals that other traders are bullish with their trading and a long position can be initiated.
- Values less than -300 indicate a bearish market sentiment and signals that other traders are bearish with their trading and a short position can be initiated.
- Values over +500 are considered extremely bullish
Values over -500 are considered extremely bearish
TICK Index Finals Thoughts – Daily Deposits Review
The TICK Index has become one of my favorite supplemental indicators to watch to confirm price action and trends in a day trading system.
Traders can take advantage of the internal market sentiment and initiate trades to capture momentum seen in the SPY.
Also, the TICK’s can be used to provide insight as when NOT to take a trade.
The TICK can be used as a risk management tool to actually keep you out of a trade. Plus it can even alert you to when the markets are turning over and to get out of your trade!
It’s important to know that breadth indicators are proven tools in the markets by the number of traders that utilize this information daily. This is truly the only tool that measures the “feelings” of the entire market!
Now…in order to implement this strategy into your daily routine, subscribe today and learn my exact tips and tricks that I use every day to trade the markets!