
Before I share with you my trading plan for next week, I want to take a quick moment to stress to you how important it is to have a gameplan.
You see, early in the week, I was on the ropes.
Before the market’s selloff late Tuesday, bulls remained in full control.
And by lunchtime Tuesday… I was down $60,000 on the year!
It’s easy to get rattled when things aren’t going your way…
But I had full confidence in my trading plan.
I could have thrown in the towel…
Given up on my bearish thesis.
Instead, I stuck to my guns…
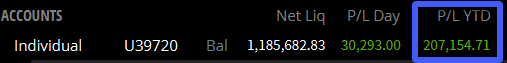
By the close of business Tuesday… I was up $75,000 ytd.
As the major index ETFs bumped into their 200-period simple moving average on the hourly chart, I closed out my bearish trades and locked in my profits.
By the end of the week, I finished up a whopping $207,154.71!
Talk about a Masterclass in trading!
Moving on.
As I survey the landscape for this upcoming week, I see tons of opportunities.
So, you can understand why I’m excited.
While the rocky market scared a lot of bulls last week, I think we’ve got room to run, and here’s why.
Contents
Gravitational line support
In case you hadn’t read my previous post, I look at the 200-period simple moving average as a place of support and resistance in my trading. I even know of some institutional traders that use this technical indicator.
As traders, getting one signal is like seeing a dark sky. It’s only one sign it might rain. But when you get the wind howling, and thunder and lightning, odds are pretty good that it will at least drizzle.
When I saw the SPY ETF which tracks the S&P 500 hit the gravitational line, I raised an eyebrow.
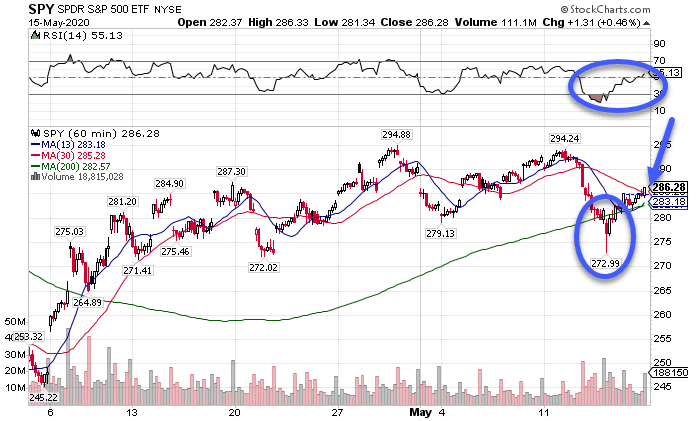
SPY Hourly Chart
But when I saw it on the DIA Dow Jones ETF and the IWM Russell 2000 ETF, I covered most of my short positions.
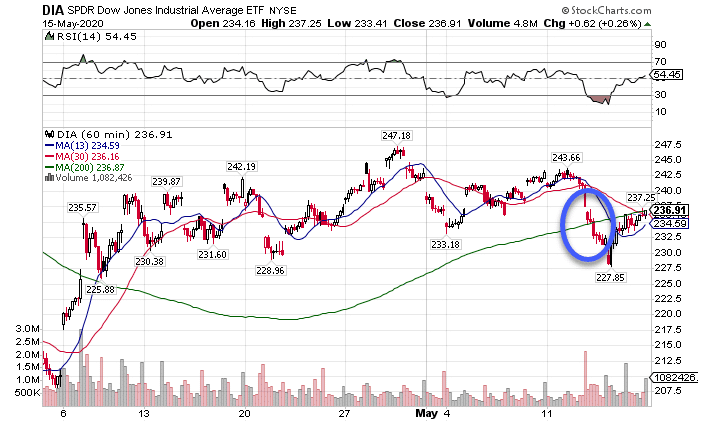
DIA Hourly Chart
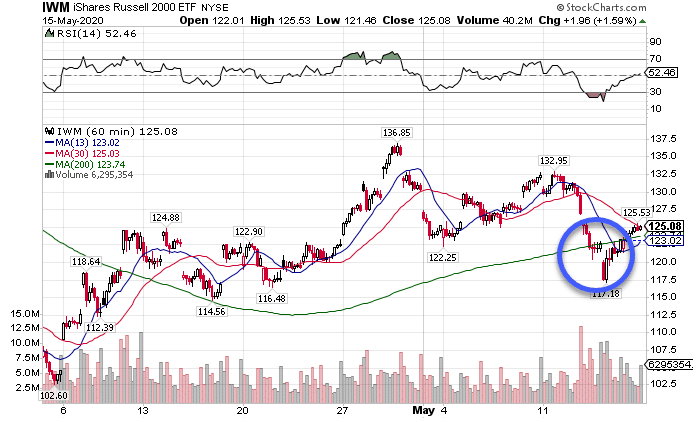
IWM Hourly Chart
With each of these charts, the lows corresponded with an oversold signal from the Relative Strength Index (RSI) at the top of the charts.
You’re probably wondering, did I catch all of the move?
Nope, and nor did I expect to. Instead, I relied on scaling out of my trades. While I didn’t capture every tick, I got enough to make a tidy profit.
Turning to this week’s market action, notice how most of the charts recaptured (closed back above) the 30-period simple moving average (red line). That is a short-term signal of strength.
When I combine that with the rapid ascent off the bottom, my analysis reads the market as bullish. None of the major indexes broke down below key support levels. Until they do, the market remains bullish.
What they did accomplish is scaring the bulls a little bit. That takes some of the sentiment out of stocks and makes it easier to push them higher.
Now, coming into this week I still have a slightly bearish bias. However, here’s how I have my Total Alpha portfolio setup:
- My short-term trades are bullish. I’m playing these through long call options as well as put credit spreads.
- However, long-term trades remain bearish. These are mainly call credit spreads.
Day to day, I’m taking light positions. However, once we hit extremes in the markets – levels we haven’t seen in weeks – I plan to take on larger trades. However, I always leave room for scaling into positions when I can.
Oil and gold – two bullish sectors
A few weeks ago oil hit negative $41 a barrel. Today, it’s trading just shy of $30 a barrel. Above $20 a barrel, most drillers can at least break even.
Looking at the chart itself, oil has all the hallmarks of a market that wants to continue running.
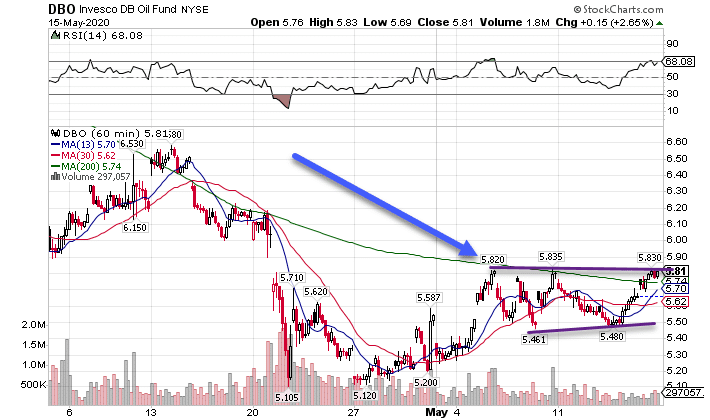
DBO Hourly Chart
Note: Oil ETPs have been knocked out of sorts because of negative crude oil. While the best charts use oil futures, I’ve used the DBO as a proxy since it shows approximately the same information for the timeframe I’m looking at.
Again, we see the importance of the gravitational line. Oil found resistance for a couple of weeks. After making a consolidation pattern, it appears to be breaking out above those levels. That could give it the energy (pun intended) to recapture another 30% or more from current prices.
On the other end of risk is the gold safety play. Despite stocks rallying hard, gold continues to make bullish move after bullish move.
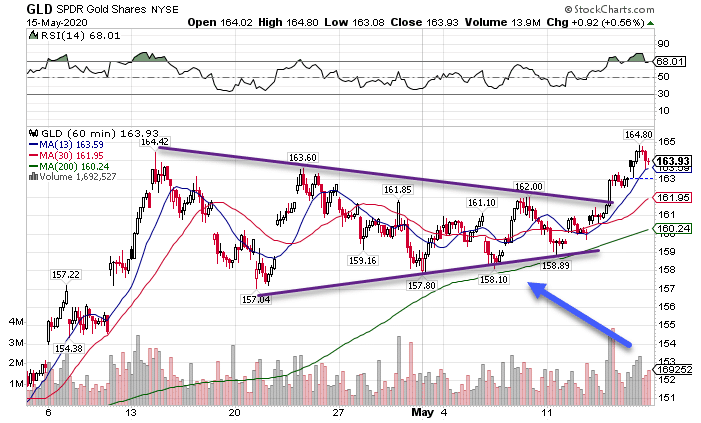
GLD Hourly Chart
Again, we see the gravitational line acting as support. This time, the bullish consolidation pattern lasted for over a month. Now, it appears gold wants to make its next leg higher.
While it can make explosive moves, I found it best to use put credit spreads on this trade and collect premium along the way.
Taking on individual stocks
Since the bottom formed in March, we’ve seen stocks separate into the haves and have nots. Companies like Netflix, Amazon, and Shopify continue to make all-time highs, while Delta Airlines, Boeing, and Avis Car Rental are a fraction of the market cap they once were.
So, how do I know which stocks are which and how to play them?
With the very same techniques, I teach in my Options Masterclass. This course is designed to take you from key option concepts to my newly revealed stock lifecycle analysis.
These are the same concepts and skills I use to trade this very market.
Click here to learn more about my Options Masterclass.
Source: TotalAlphaTrading.com | Original Link